Application Exercise 8c: Constructing and analysing charts

1. Using the data provided in Table 8.3, construct a chart to demonstrate the trend in the BOGS over the period shown. You can use Excel or another software. Ensure the axes are accurately labelled and your chart includes a title.
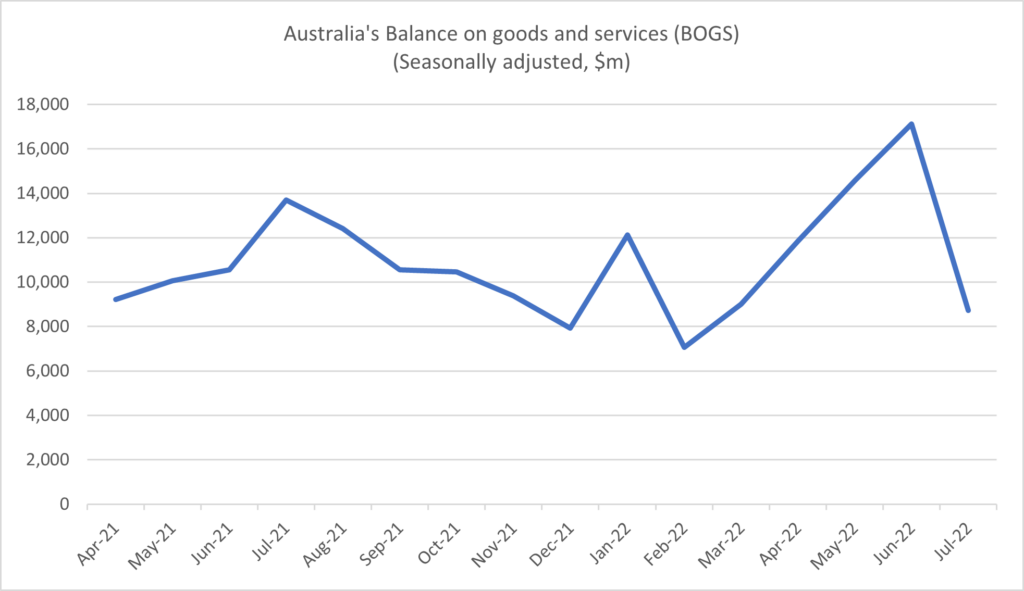
2. Compare the most recent data for the BOGS to the data provided in Chart 8.4. Describe the key differences between the longer-term performance of the BOGS and the performance over the last 2 years.
Over the longer term, since 2000, Australia’s BOGS followed a relatively flat trend (fluctuating between $5 billion in deficit and $5 billion in surplus) until mid-2016. Since then, it was trended upwards strongly, remaining consistently in surplus, reaching a surplus of over $16 billion in mid-2022. A key difference between the longer-term trend and the more recent data (as shown in the chart created in Question 1 above) is that over the last two years the BOGS has not fallen below $7 billion in surplus and has fluctuated between $7 billion and $17 billion in surplus each month. This would indicate Australia’s trade balance has moved away from the longer-term trend of fluctuating between a small surplus and a small deficit over time.
3. Outline one possible reason for the difference described in Question 2 above. (Hint: consider what Australia exports most of and what has been happening to the prices of these products over the last two years.)
One key reason for the steadily-rising BOGS surplus in recent years (since around 2016) is the rapid rise in commodity prices globally. Australia is a major global commodity exporter, and commodities make up a large proportion of Australia’s exports (including coal, iron ore, aluminium ores, copper, gas, beef, gold). Commodity prices are set on the global market, and therefore when they rise that means Australia simply gets a ‘pay rise’ for everything it exports (generally without losing its share of the global market.) This has resulted in rapid rise in the value of Australia’s exports relative to the value of its imports, leading to a rise in the trade balance / BOGS and a consistent surplus over recent years.