Application Exercise 10j interrogation

- Data taken from Tables 10.17 and 10.18

Analysis
The chart above compares the wealth of the top ten billionaires (the richest people in the world) and the GDP of selected countries. While there are no billionaires whose wealth comes close to the GDP of Australia, the GDP of New Zealand is only marginally greater than the wealth held by Elon Musk, who was the richest person in the world at the time of publication. In addition, there are numerous countries whose whole economies are considerably smaller than the wealth of these billionaires. The size of the wealth holidays of these individuals being some much greater than the production generated by whole countries (with populations of millions of people) shows just how unequal is the distribution of resources and wealth in the world
Analysis
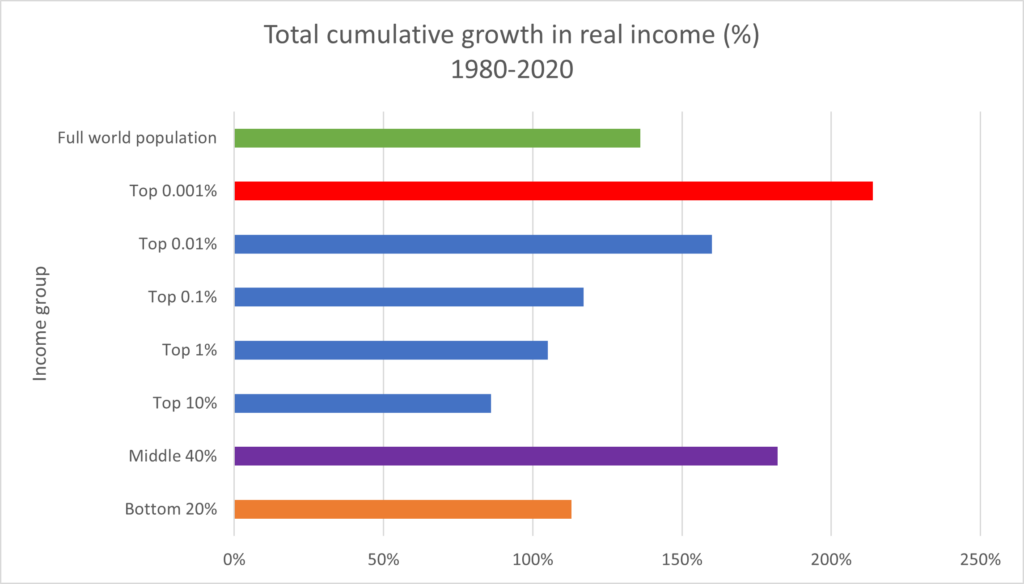
The chart above shows the total cumulative growth in real income of a number of different income groups, globally, over the 40 years between 1980 and 2020. The top bar (green) shows that across the whole global population, incomes have increased by also 150% across that 40-year period. However, the most notable changes are in the growth of incomes of the bottom 20% of income recipients globally. These are shown by the orange bar, and they have grown by a smaller percentage compared to the whole world’s income growth. The large income growth (over 200%) was experienced by those who were already the richest people in the global population – the top 0.001% (one one-thousandth of the global population.) This is shown by the red bar. Overall, it can be seen that the incomes of the richest have grown the fastest, while the incomes of the poorest are growing very slowly relative to average income growth. This means that, while all the incomes of most people across the globe have grown in real terms, those who are already well off have benefited the most.
Also of note is that the incomes of the middle 40% of the global population have grown by the second-largest proportion – as shown by the purple bar. This can be substantially attributed to the industrialisation and growth of China as a global economic superpower very this period.