Application Exercise 3f: Shifts of demand and supply curves
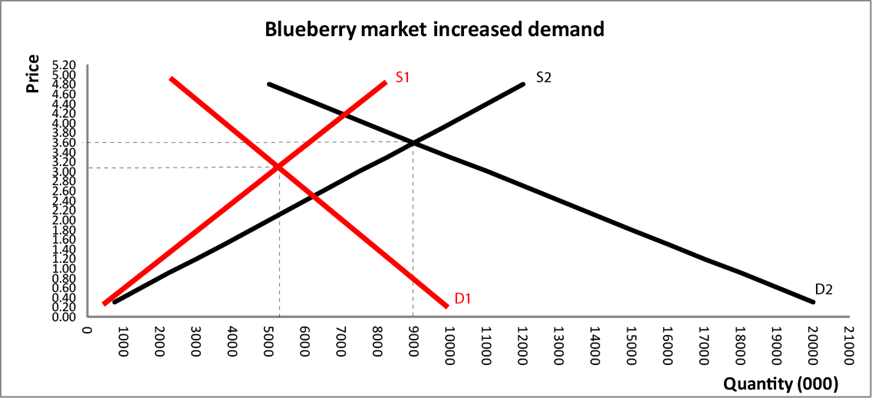
1) The new and old demand and supply curves appear below.
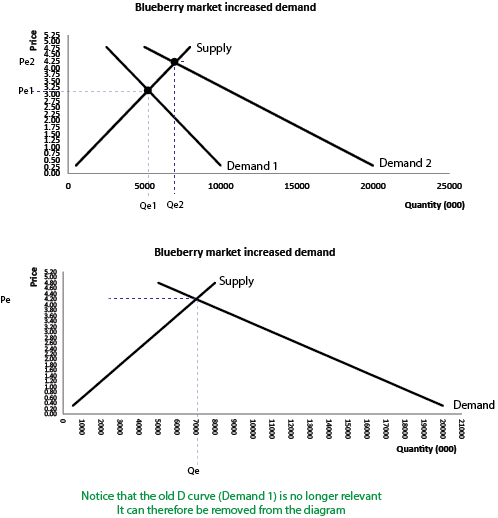
2) The equilibrium price increases from $3.15 to $4.20 and the equilibrium quantity increases from 5,250, 000 blueberries to 7,000,000 blueberries.
3) One obvious factor is the one listed in the question, which is the release of a favourable government report which suggests that blueberry consumption improves health outcomes. There are numerous other factors that could potentially cause an increase in demand for blueberries, such as a rise in the price of a substitute such as blackberries or raspberries. As the price of these substitutes increase, consumers will be enticed to purchase the relatively cheaper blueberries which will increase demand and cause the demand curve to shift to the right. Alternatively, there may have been an increase in disposable income that resulted in consumers increasing their demand for a multitude of goods and services.
5) See diagram below.
6) At the old equilibrium price of $3.15 (as discussed in question 4) the market will move to a position of disequilibrium characterised by excess demand (or market shortage). Stocks of blueberries in markets will become depleted and suppliers will naturally increase prices in order to maximise profits. The higher price will reduce the demand for blueberries as well as the shortage. The price will continue to rise until the shortage is eliminated and equilibrium is restored (i.e. at a price of $3.60)
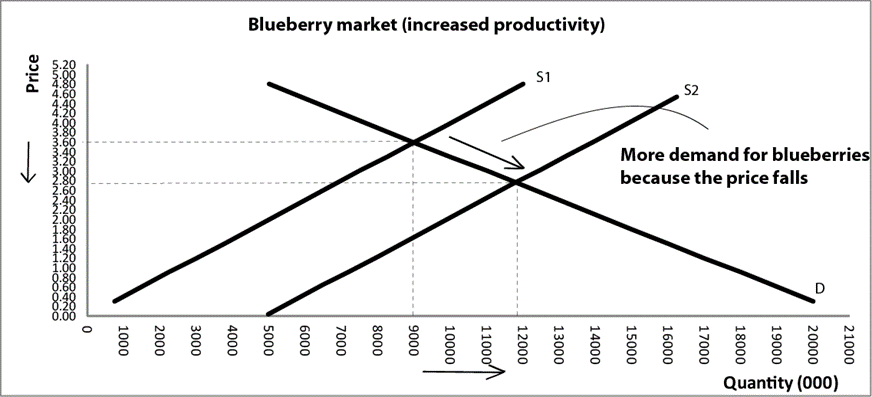
7) The demand for blueberries will indeed increase because the price of blueberries falls following an increase in productivity. This is commonly referred to as an expansion of demand or a movement along the demand curve. This is highlighted in the diagram below.
8. If the price of blueberries was $4.20 the market would be in disequilibrium that is characterised by excess supply (i.e. a surplus). Sellers or suppliers will simply end up with too much stock at the end of each trading day and in order to eliminate surplus stock, suppliers will inevitably reduce the price. The price will continue to fall over time until the excess supply is eliminated.
9. The supply curve could shift to the left for various reasons. One obvious factor is a rise in the costs of production caused by higher labour costs or a fall in productivity. Another obvious factor is an unfavourable climatic event such as a drought, flood, or other natural disaster which destroys part or all of a blueberry crops.
10. If it is assumed that olives can be grown in the region, then a higher price of olives increases the opportunity costs associated with the production of blueberries. In other words, by continuing to produce blueberries when Olive production could prove more profitable, Charlotte is making a bigger sacrifice. Accordingly, if we assume that Charlotte is a profit maximising producer and she considers that the higher price of olives will persist into the future, she is likely to devote some (or more) of her land to Olive production, which necessarily means that less of her land will be devoted to blueberry production (unless she purchases an additional farm to focus on Olive production).